Improve Core Web Vitals on WordPress: How I Got to 100
Related service: Technical SEO audit and Core Web Vitals
One WordPress site scored 56 for mobile performance in August 2026 and scores 100 now.
Four findings did most of the work to improve core web vitals here.
A cache plugin lazy-loading the LCP image. A hero portrait sitting below the copy on mobile.
On this page
Analytics competing with the page, and an unsubsetted font.
No plugin did this. 2 of the 4 findings that mattered were caused by a plugin.
Where did the score start?
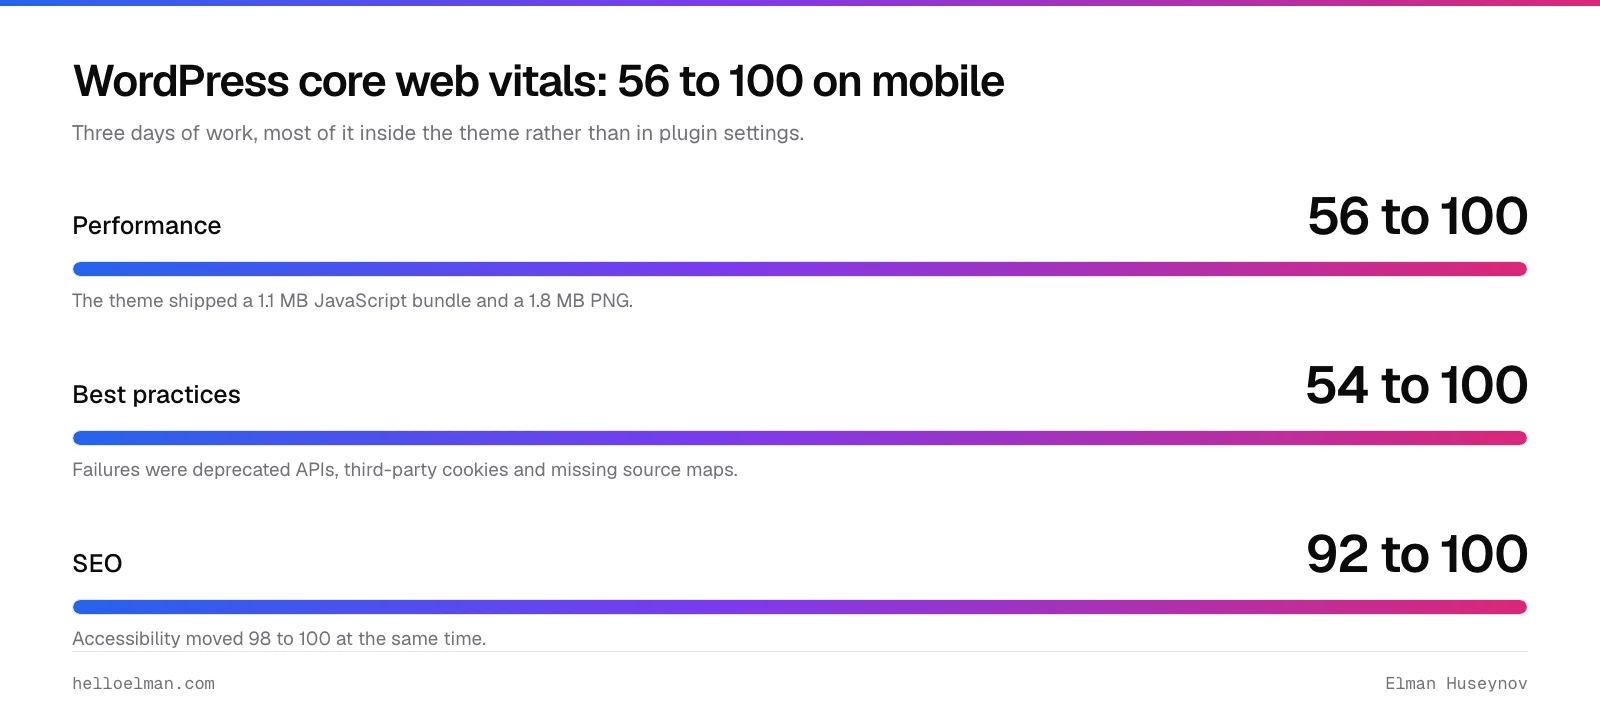
Lighthouse on mobile read 56 performance, 54 best practices, 92 SEO.
The theme shipped a 1.1 MB JavaScript bundle. three.js at about 600 KB, GSAP, a smooth-scroll library, a lightbox, a carousel.
jQuery 3.1.1 from 2016. The full Font Awesome set for a few icons. A 1.8 MB PNG.
| Category | Mobile before | Mobile after |
|---|---|---|
| Performance | 56 | 100 |
| Accessibility | 98 | 100 |
| Best practices | 54 | 100 |
| SEO | 92 | 100 |
Optimise the old theme or replace it?
The answer was neither. I added a second front-end inside the old theme. A function decides which layer serves each request.
New templates get about 20 KB of hand-written CSS and no jQuery. The old portfolio templates keep their stack.
Splitting the theme cost a day. Rewriting everything would have cost a month and delivered the same score.
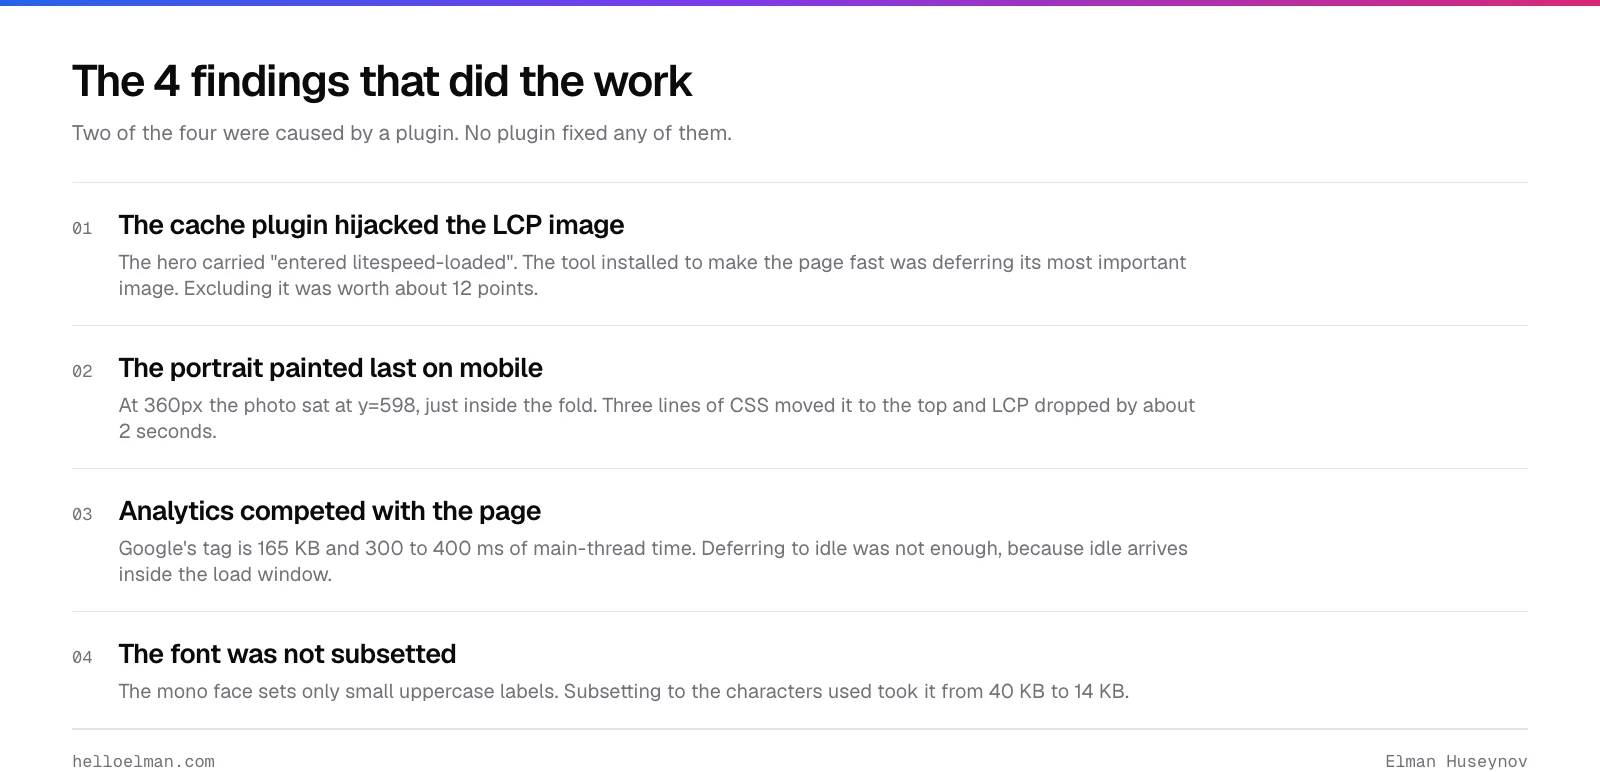
How to improve core web vitals on WordPress: the 4 findings
1. The cache plugin was hijacking the LCP image
The largest contentful paint element carried the classes entered litespeed-loaded.
The plugin installed to make the page fast was lazy-loading its most important image. Excluding it was worth about 12 points.
A performance plugin optimises for its own defaults. Your LCP element is exactly the thing it should not touch.
2. The portrait painted last on mobile
On a 360px viewport the hero photo sat at y=598, just inside the fold. So it counted as the LCP element.
Three lines of CSS moved it to the top on 1 column. LCP dropped by about 2 seconds.
@media (max-width: 899px) {
  .hero__portrait { order: -1; max-width: 260px; }
}
3. Analytics in the load window
Google’s tag is 165 KB. It costs 300 to 400 ms of main-thread time on a throttled phone.
Deferring it to idle was not enough. On a fast connection idle is at 1.5 seconds, inside the load window.
The rule that shipped: load on the first pointer, key or scroll event. Fallback, 2 seconds after load.
Total blocking time was 100 to 480 ms before. After, 20 to 120 ms.
4. An unsubsetted font
The monospace face only sets small uppercase labels: dates, category names, section numbers.
Subsetting it to the characters used took it from 40 KB to 14 KB.
pyftsubset geist-mono.woff2 \
  --unicodes="U+0020-007E" \
  --flavor=woff2 --layout-features='' \
  --output-file=geist-mono-labels.woff2
Check the subset covers everything. Mine was missing the tick and cross glyphs, and Chrome silently substituted another face.
More ways to improve core web vitals, in order of value
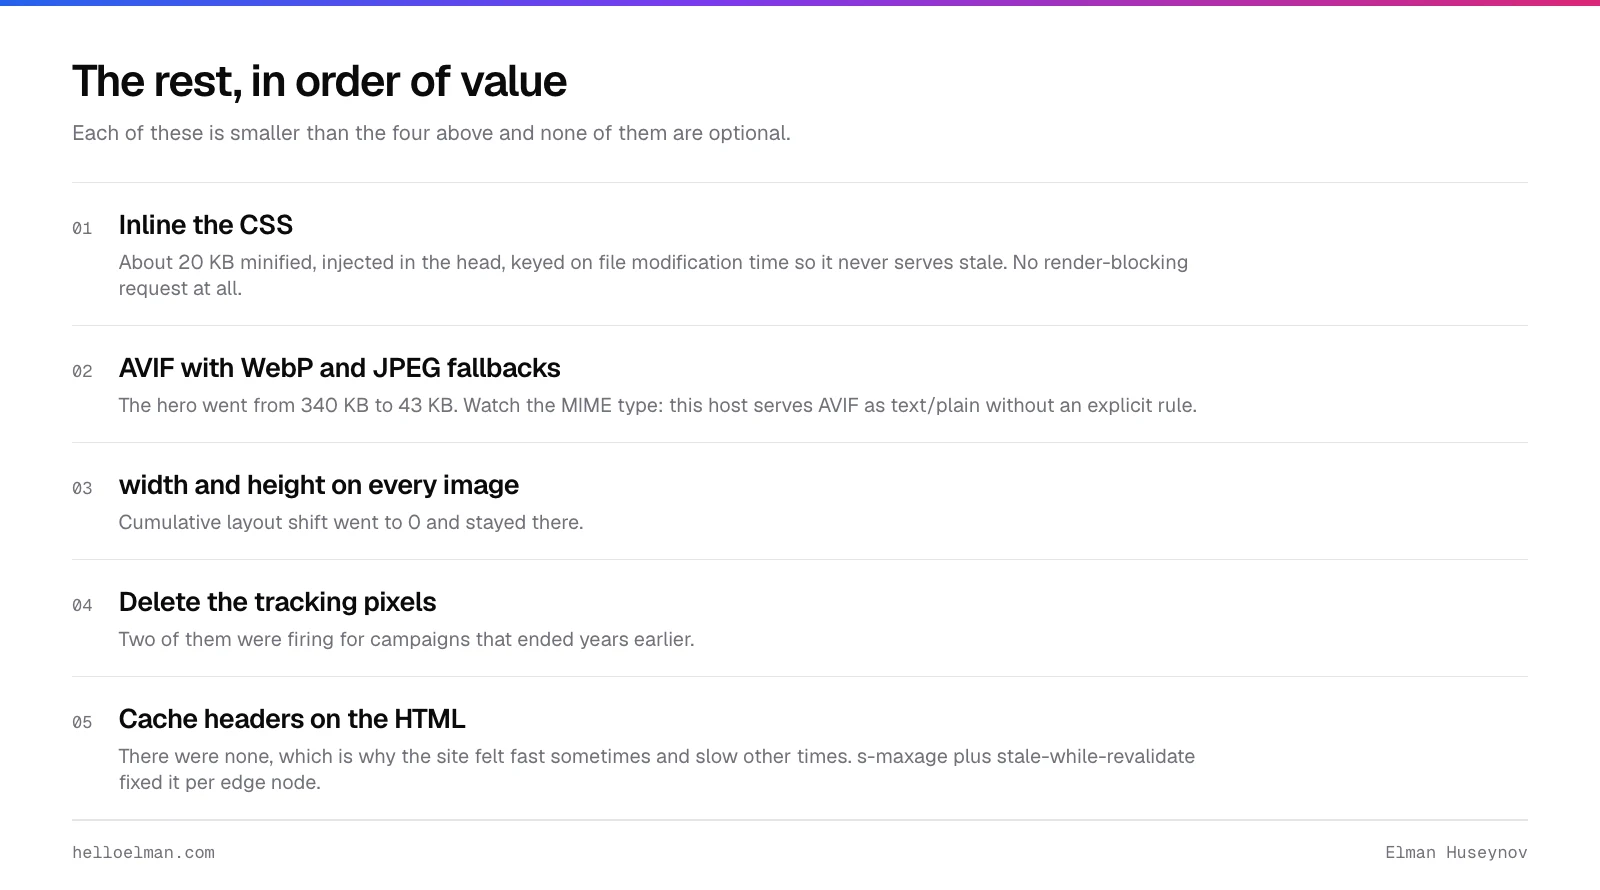
- Inline the CSS. About 20 KB, minified, in the head. No render-blocking request at all.
- AVIF with WebP and JPEG fallback. The hero went from 340 KB to 43 KB. This host served AVIF as
text/plainwithout an explicit rule. widthandheighton every image. Cumulative layout shift went to 0 and stayed there.- Delete the tracking pixels. 2 were for campaigns that ended years ago.
- Cache headers on the HTML. There were none.
s-maxageplusstale-while-revalidatefixed the fast-sometimes, slow-sometimes feel.
What did not improve core web vitals here?
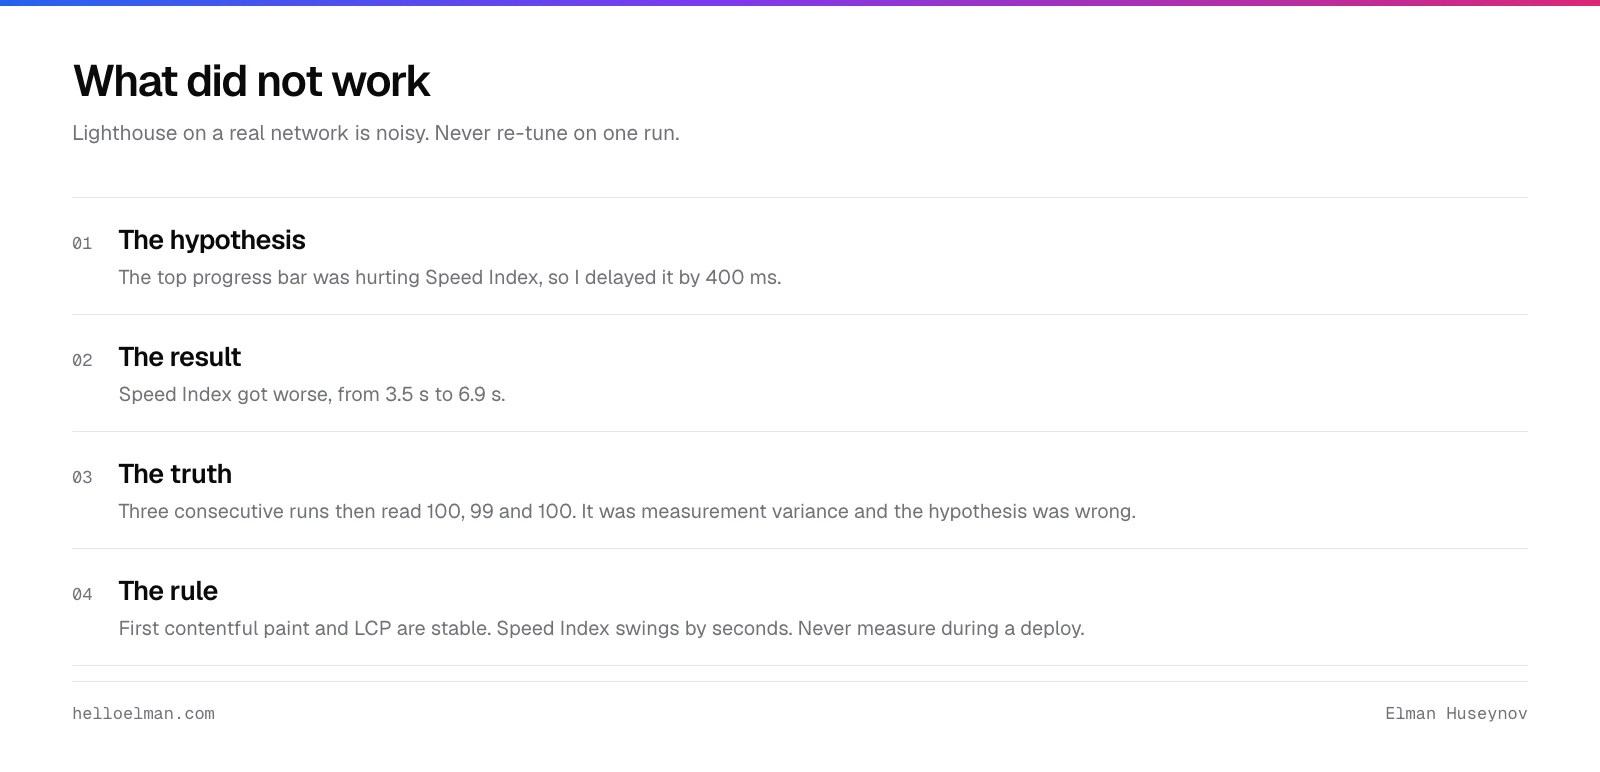
I thought the top progress bar was hurting Speed Index. I delayed it by 400 ms.
Speed Index got worse, from 3.5 s to 6.9 s. Then 3 consecutive runs read 100, 99 and 100.
Measurement variance, and my hypothesis was wrong. Speed Index swings by seconds on a real network; FCP and LCP stay stable.
Never re-tune on 1 run, and never measure during a deploy.
What did it take?
The rebuild took 3 days, most of it in the theme rather than in settings.
The second front-end, the 4 findings, and the images produced the score. The plugin toggles I tried first produced nothing.
Settings alone would have left the score near 56.
Common questions
Can a caching plugin make Core Web Vitals worse?
Yes, and it happened here. LiteSpeed’s lazy-load applied itself to the hero image, which was the LCP element. It deferred exactly the thing the page most needed. Excluding the LCP image from lazy-loading was worth about 12 points. Check what your plugin is doing to your largest element.
How long does it take to get a WordPress site to 100?
About 3 days here, most of it inside the theme rather than in plugin settings. The plugin toggles I tried first produced almost nothing. If your theme ships a megabyte of JavaScript, no amount of configuration reaches 100. The work is a front-end rewrite of the templates that matter.
Does a 100 Lighthouse score actually matter for ranking?
Core Web Vitals are a ranking signal and a weak one next to content. The bigger return is fewer people leaving before the page paints. And a site that works on a mid-range phone on mobile data. Chase the field data in Search Console rather than the lab score.
Why do Lighthouse scores change between runs?
Speed Index swings by seconds on a real network. First contentful paint and LCP stay stable. I once delayed a progress bar by 400 ms. Speed Index went from 3.5 to 6.9 seconds. Then 3 consecutive runs read 100, 99 and 100. Never re-tune on 1 run.
How do you speed up a WordPress site?
Find what delays the largest element on mobile, then fix that. Here it was a caching plugin lazy-loading the hero image. An unsubsetted font was the other cause. Adding another plugin is not the fix. Measure field data before and after, not the lab score.
The short version
Find your LCP element and make sure nothing is deferring it, including your cache plugin. Check where it sits on a 360px screen.
Get third-party scripts out of the load window. Subset your fonts and check the subset. Measure 3 times before believing anything.
3 sites, 3 stacks, live scores: the Core Web Vitals and technical SEO page. Same method each time.